AOnly 2014
BOnly 2014 and 2017
COnly 2014 and 2015
D2014, 2015 and 2016
AOnly 2014
BOnly 2014 and 2017
COnly 2014 and 2015
D2014, 2015 and 2016
Related Questions:
The graph shows Income and Expenditure(Rs. in lakhs) of a company.The expenditure from 2002 to 2003 increased by:

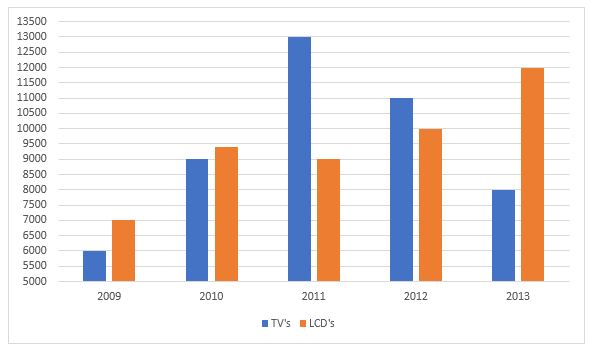
The number of the production of electronic items (TVs and LCDs) in a factory during the period from 2009 to 2013.The total number of products of electronic items is maximum in the year?