A12:7
B2:3
C17:14
D14:13
A12:7
B2:3
C17:14
D14:13
Related Questions:
Study the following table, which shows the number of units of a product manufactured and sold by a company in five years, and answer questions
Years | Number of units (in thousands) Manufactured | Sold |
2013 | 350 | 320 |
2014 | 375 | 315 |
2015 | 300 | 280 |
2016 | 450 | 423 |
2017 | 420 | 360 |
The ratio of the total number of units sold in 2014 and 2015 to the number of units manufactured in 2017 is:
Study the following table, which shows the number of units of a product manufactured and sold by a company in five years, and answer questions
Years | Number of units (in thousands) Manufactured | Sold |
2013 | 350 | 320 |
2014 | 375 | 315 |
2015 | 300 | 280 |
2016 | 450 | 423 |
2017 | 420 | 360 |
What percent of total units of the product manufactured in 2013 and 2015 is equal to the total units unsold during the five years? (correct to one decimal place)
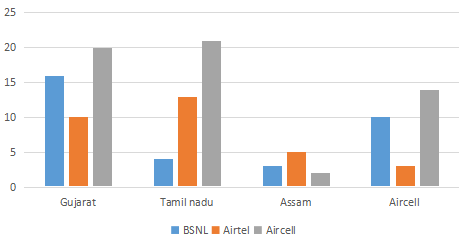
The number of mobile simcards in 4 states are given in multiple bar diagrams.In which state are there the largest number of owners of Airtel simcard ?#