The graph shows the result of 10th class students of a school for 4 years.
The year in which the maximum number of students appeared for the 10th class exam is:
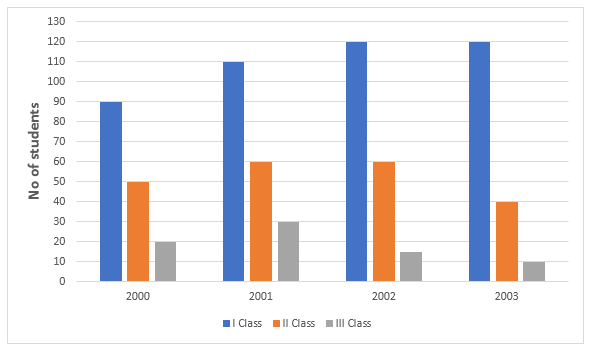
A2001
B2002
C2003
D2004
The graph shows the result of 10th class students of a school for 4 years.
The year in which the maximum number of students appeared for the 10th class exam is:
A2001
B2002
C2003
D2004
Related Questions:
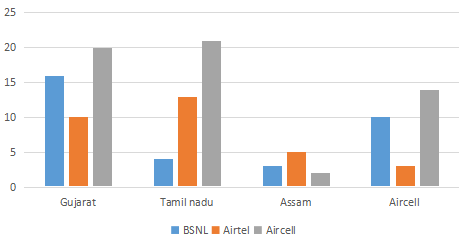
The number of mobile simcards in 4 states are given in multiple bar diagrams.In which state are there the largest number of owners of Airtel simcard ?#
The following pie-chart shows the number of students who failed in different subjects in an examination, Examine the chart and answer the following questions. The total number of students who have failed in 500.

The number of students failed in science is less than the number of students failed in all other subjects by:
The given pie-chart represents the percentage of students enrolled in five different sports. The total number of students is 2800.
What is the average number of students enrolled in Hockey and Tennis together ?
The given chart shows the number of students in Class 4, Class 5, Class 6 and Class 7 who got first class, second class and failed in the final examinations.
What is the pass percentage of Class 4?