A13.28%
B14.58%
C16.46%
D15.95%
A13.28%
B14.58%
C16.46%
D15.95%
Related Questions:
The line chart given below represents the revenue (in Rs. Crores) of a company for 6 years.What is the average revenue (in Rs crores) for given 6 years?
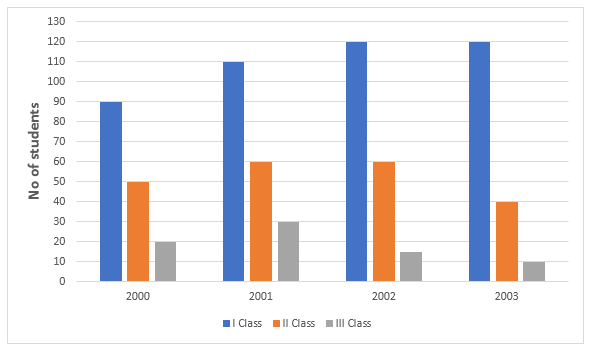
The graph shows the result of 10th class students of a school for 4 years.
The year in which the maximum number of students appeared for the 10th class exam is:
Study the following carefully and answer the question.
For Company A , what is the approximate percentage decrease in production from 2015 to 2016?