A23.4%
B25.6%
C18.5%
D21.6%
A23.4%
B25.6%
C18.5%
D21.6%
Related Questions:
The given bar graph represents the Percentage of non-electrified villages in 6 states A, B, C, D, E and F. Study the graph and answer the question that follows.
How many states have at most 30% or less non-electrified villages?
The bar chart given below shows the annual production (in 1000 tonnes) of coffee of a country for years 2009 to 2013.
The production for the year 2011 is what percent of the production for the year 2009?
The bar graph shows the number of cars sold by a distributor in each month from January to June.
How many more cars did he sell in the second quarter as compared to the first?
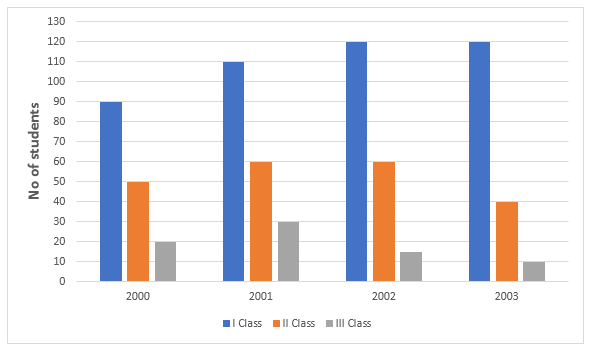
The graph shows the result of 10th class students of a school for 4 years.
The year in which the maximum number of students appeared for the 10th class exam is: